At first glance, the term “yield curve” might sound like complex investment jargon, but understanding it can give you valuable insight into where the economy might be headed. It’s a simple concept, but its powerful implications might soon have you bringing it up at social gatherings. This tool helps forecast the bond and stock markets and has a history of predicting economic shifts, including recessions. Let’s break it down in a way that actually makes sense.
What is the Treasury Yield Curve?
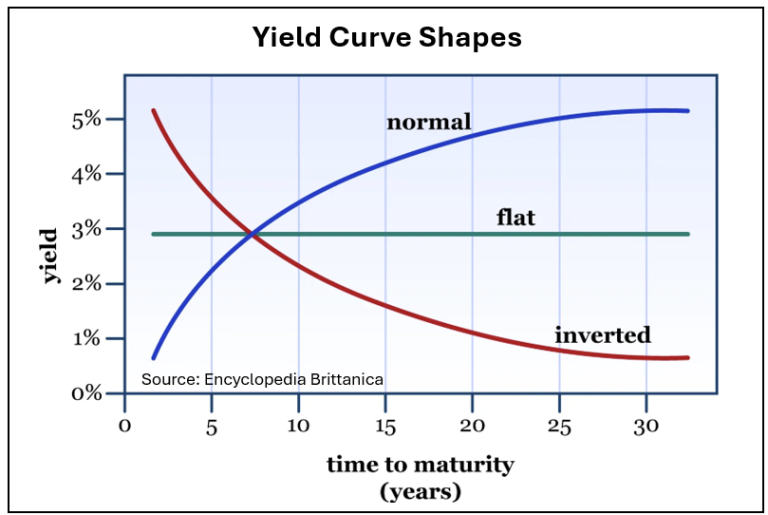
The Treasury yield curve is a graphical representation of the yields on U.S. Treasury securities across various maturities from one month to 30 years, with yields on the vertical axis and maturities on the horizontal axis. The yield, in this context, represents the return an investor expects from holding a Treasury debt security until it matures. The three general shapes of the curve (normal, flat, and inverted) are illustrated and described below:
Here’s the gist:
- Normal Yield Curve: Longer-term bonds have higher yields than short-term ones. This suggests a healthy economy with steady growth.
- Flat Yield Curve: Short and long-term bond yields are more similar. This signals uncertainty—investors aren’t sure if the economy will grow.
- Inverted Yield Curve: Short-term bonds offer higher yields than long-term ones. Historically, this has been a red flag for a potential recession.
Diving Deeper: What Each Curve Shape Means for Investors
1. Normal Yield Curve
A normal, or upward-sloping, yield curve means that longer-term debt instruments have higher yields than shorter-term ones. This shape typically indicates economic stability and growth, as investors demand higher returns for committing their capital for a longer period. A normal curve suggests that investors are confident about the economy’s growth prospects and expect interest rates to rise in the future, often as a counter to inflation. This is the most common shape of the curve.
What it means for you:
- Stocks tend to do well in this environment since economic growth drives corporate profits.
- If you’re investing in bonds, you might want to stick with short-term bonds. Why? Because interest rates are likely to go higher. Staying short-term will allow you to reinvest at higher yields in the near future. Conversely, long-term bonds will drop more in price in a rising interest rate environment.
2. Flat Yield Curve
When the yield curve flattens, it implies that the difference in yield between short-term and long-term Treasuries narrows. A flat curve often signals uncertainty about future economic growth and concerns that the economy could be nearing a peak, leading to a cautionary in investment outlook.
What it means for you:
- Although a flat curve doesn’t imply strong messages, it could be a good time to review your long-term risk levels since markets are in a state of transition.
- Interest rates could move in either direction, so consider this when assessing your options. This shape is usually short-lived as the curve transitions between the other two shapes
3. Inverted Yield Curve
An inverted yield curve occurs when short-term rates are higher than long-term rates. Historically, an inverted yield curve is a powerful recession predictor, indicating that investors expect an economic slowdown or contraction. This shape suggests that investors expect future interest rates to drop as currently high short-term rates are expected to cause a slowing in the economy. This often occurs after the Fed has raised short-term rates rapidly in the recent past.
What it means for you:
- It may be wise to shift towards more defensive investments due to the increased probability of recession.
- If you’re a bond investor, you may want to lock in long-term yields now, since interest rates may fall in the future.
Why It Matters
The Treasury yield curve isn’t just for Wall Street professionals, economists, or policymakers—it affects everyday investors, too, and provides a snapshot of market expectations. While it is just one tool, and no single tool can predict the future with 100% accuracy, it is a critical barometer of investor sentiment that impacts asset allocation, lending, and overall financial market conditions. A normal yield curve suggests optimism and stability, while an inverted curve signals caution and a potential economic slowdown. By monitoring changes in the yield curve, stakeholders in the economy can make more informed decisions and prepare for possible economic shifts ahead.
So, next time someone mentions the economy at a social gathering, you’ll have some real insights to add!
Content in this material is for general information only and not intended to provide specific advice or recommendations for any individual. All performance referenced is historical and is no guarantee of future results. Bond yields are subject to change. Certain call or special redemption features may exist which could impact yield.